restrict_range() restricts wavenumber ranges to user specified values.
Multiple ranges can be specified by inputting a series of max and min
values in order.
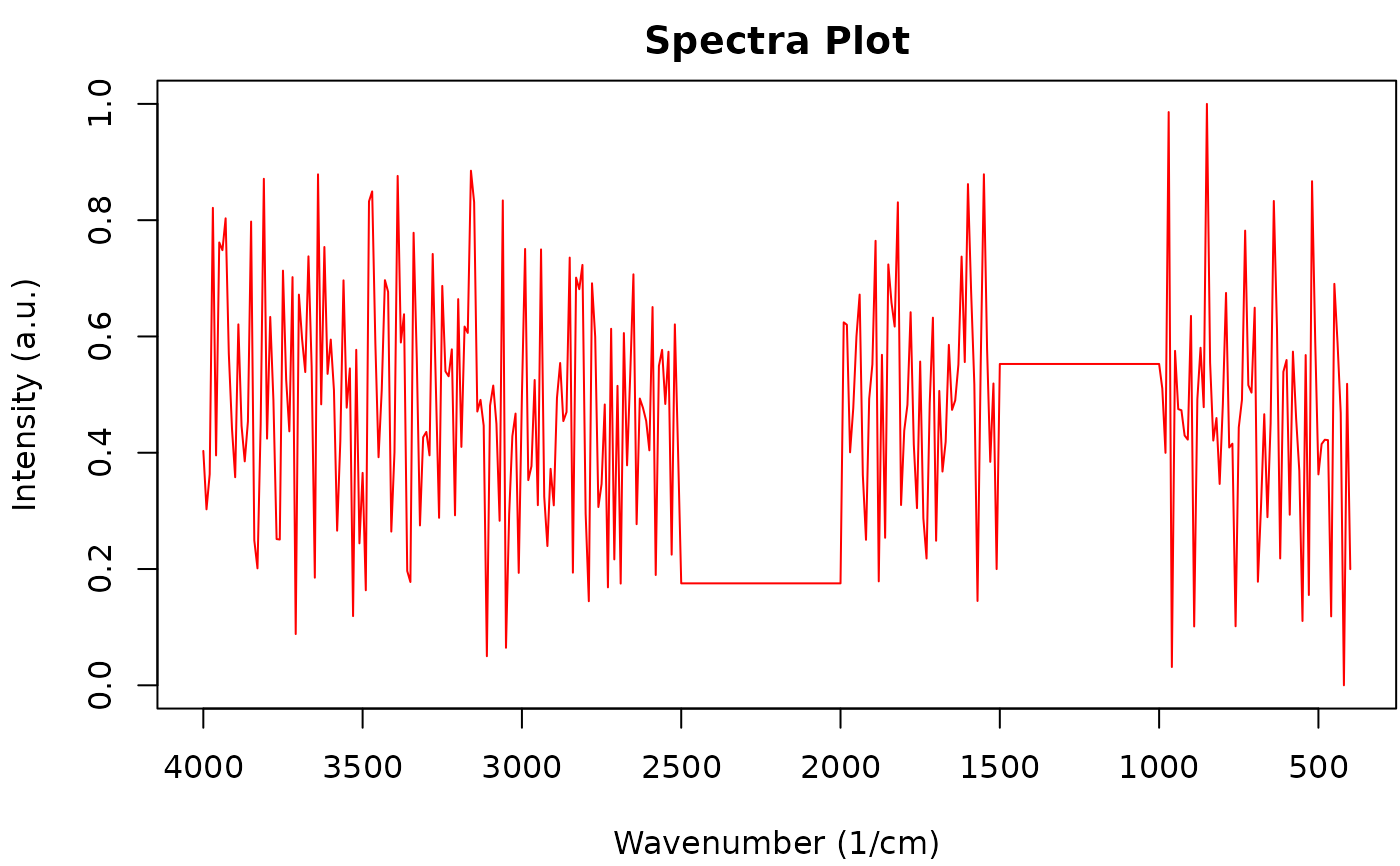
flatten_range() will flatten ranges of the spectra that should have no
peaks.
Multiple ranges can be specified by inputting the series of max and min
values in order.
Usage
restrict_range(x, ...)

# Default S3 method
restrict_range(x, ...)

# S3 method for class 'OpenSpecy'
restrict_range(
  x,
  min = NULL,
  max = NULL,
  make_rel = TRUE,
  automate = FALSE,
  artifact_ratio = 3,
  tail_n = 5L,
  co2_region = c(2200, 2420),
  max_crop = 0.2,
  ...
)

flatten_range(x, ...)

# Default S3 method
flatten_range(x, ...)

# S3 method for class 'OpenSpecy'
flatten_range(
  x,
  min = 2200,
  max = 2400,
  make_rel = TRUE,
  automate = FALSE,
  artifact_ratio = 3,
  tail_n = 5L,
  ...
)
Arguments
- x
an
OpenSpecyobject.- min
a vector of minimum values for the range to be flattened.
- max
a vector of maximum values for the range to be flattened.
- make_rel
logical; should the output intensities be normalized to the range [0, 1] using
make_rel()function?- automate
logical; if
TRUE, first assess the relevant artifact and only restrict a high tail or flatten a high CO2 region when detected.- artifact_ratio
numeric; minimum artifact-to-control maximum ratio.
- tail_n
integer; number of points defining each spectral tail.
- co2_region
numeric length two; carbon dioxide exclusion region used by automatic tail assessment.
- max_crop
numeric; maximum fraction of the full wavenumber span that automatic tail restriction may remove across both ends.
- ...
additional arguments passed to subfunctions; currently not in use.
Value
An OpenSpecy object with the spectral intensities within specified
ranges restricted or flattened.
See also
conform_spec() for conforming wavenumbers to be matched with
a reference library;
adj_intens() for log transformation functions;
min() and round()
Examples
test_noise <- as_OpenSpecy(x = seq(400,4000, by = 10),
spectra = data.frame(intensity = rnorm(361)))
plot(test_noise)
 restrict_range(test_noise, min = 1000, max = 2000)
#> wavenumber intensity
#> <num> <num>
#> 1: 1000 0.7779144
#> 2: 1010 0.4108821
#> 3: 1020 0.7862717
#> 4: 1030 0.4993344
#> 5: 1040 0.3027464
#> ---
#> 97: 1960 0.5593439
#> 98: 1970 0.4760214
#> 99: 1980 0.7164056
#> 100: 1990 0.7209565
#> 101: 2000 0.1502945
#>
#> $metadata
#> x y license col_id file_id
#> <int> <int> <char> <char> <char>
#> 1: 1 1 CC BY-NC intensity 7f0c522b3f5dd2daf7a24cdd3ead3366
restrict_range(test_noise, automate = TRUE, make_rel = FALSE)
#> wavenumber intensity
#> <num> <num>
#> 1: 400 -1.400043517
#> 2: 410 0.255317055
#> 3: 420 -2.437263611
#> 4: 430 -0.005571287
#> 5: 440 0.621552721
#> ---
#> 357: 3960 -0.384007254
#> 358: 3970 1.827125177
#> 359: 3980 -0.551491750
#> 360: 3990 -0.865753541
#> 361: 4000 -0.343831481
#>
#> $metadata
#> x y license col_id file_id
#> <int> <int> <char> <char> <char>
#> 1: 1 1 CC BY-NC intensity 7f0c522b3f5dd2daf7a24cdd3ead3366
flattened_intensities <- flatten_range(test_noise, min = c(1000, 2000),
max = c(1500, 2500))
plot(flattened_intensities)
restrict_range(test_noise, min = 1000, max = 2000)
#> wavenumber intensity
#> <num> <num>
#> 1: 1000 0.7779144
#> 2: 1010 0.4108821
#> 3: 1020 0.7862717
#> 4: 1030 0.4993344
#> 5: 1040 0.3027464
#> ---
#> 97: 1960 0.5593439
#> 98: 1970 0.4760214
#> 99: 1980 0.7164056
#> 100: 1990 0.7209565
#> 101: 2000 0.1502945
#>
#> $metadata
#> x y license col_id file_id
#> <int> <int> <char> <char> <char>
#> 1: 1 1 CC BY-NC intensity 7f0c522b3f5dd2daf7a24cdd3ead3366
restrict_range(test_noise, automate = TRUE, make_rel = FALSE)
#> wavenumber intensity
#> <num> <num>
#> 1: 400 -1.400043517
#> 2: 410 0.255317055
#> 3: 420 -2.437263611
#> 4: 430 -0.005571287
#> 5: 440 0.621552721
#> ---
#> 357: 3960 -0.384007254
#> 358: 3970 1.827125177
#> 359: 3980 -0.551491750
#> 360: 3990 -0.865753541
#> 361: 4000 -0.343831481
#>
#> $metadata
#> x y license col_id file_id
#> <int> <int> <char> <char> <char>
#> 1: 1 1 CC BY-NC intensity 7f0c522b3f5dd2daf7a24cdd3ead3366
flattened_intensities <- flatten_range(test_noise, min = c(1000, 2000),
max = c(1500, 2500))
plot(flattened_intensities)